
- THE PRICE HAS SHOWN A STRONG MOMENTUM AND GAINED MORE THAN 5% THIS WEEK.
- THE TONCOIN DIDN’T PERFORM SINCE THE LISTING STILL TRADING NEAR TO THE LISTING PRICE.
- 50% RALLIED IN A MONTH INDICATING A STRONG BULLISHNESS IN THIS COUNTER.
MARKET CAPITAL OF TONCOIN – $ 6.21 B
CURRENT MARKET PRICE OF TONCOIN – $ 1. 8143
Technical Analysis on a 1-Day Time Frame
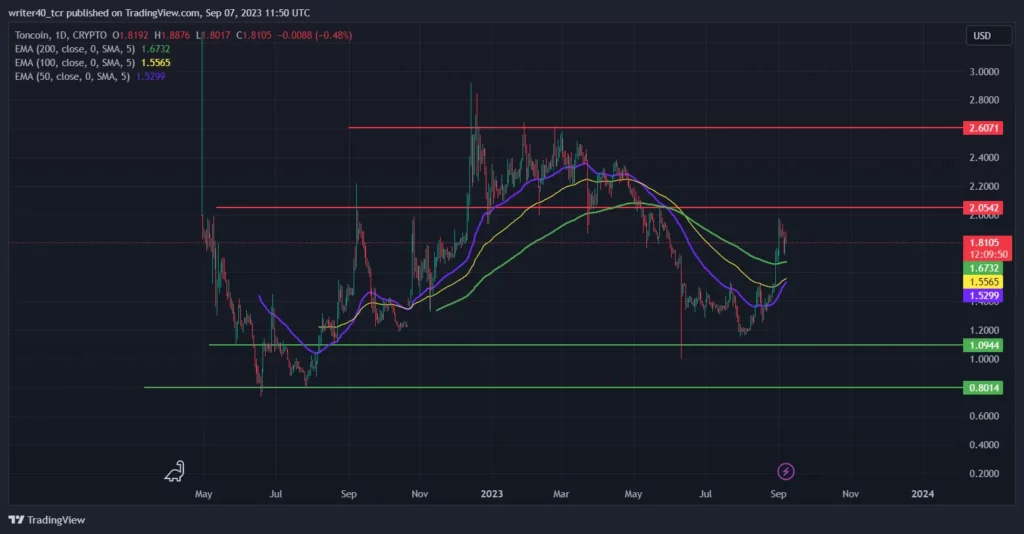
Toncoin price is currently trading above all the EMAs i.e. 50, 100, and 200. It is present at $1.52, $1.55, and $1.67 respectively, which is a bullish sign for any counter.
Price gained a strong momentum after consolidating in a single strong bearish candle for more than a month and rewarded the buyer a 5% increase in their profit.
Currently, the resistance levels are present at $2.0542 and $2.60 levels, where the sellers activated in the market previously. They will once again try to push the price down.
Support is present near the recent swing low of $1.09 and then after at $0.80 levels.
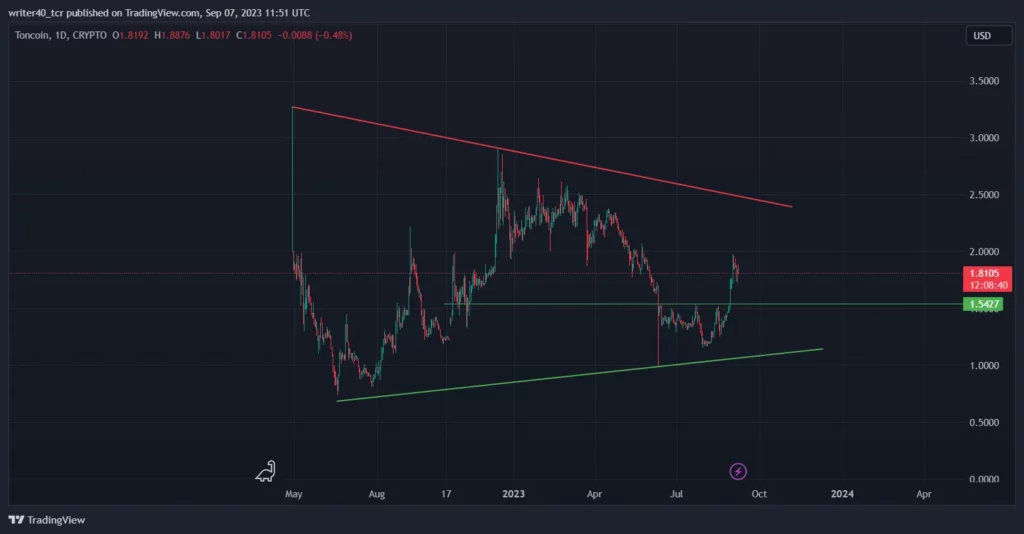
If we talk about the price action, then the recent resistance is present near the level of $1.542. It will act as support from now on.
If we connect the two swing low and two swing high as is visible on the chart, then it will take some resistance and support soon.
The kind of move that is visible on the chart makes it seem like some buyers are aggressively buying at bottom levels and expecting the price to go up soon.
Technical Analysis on a 1-Hour Time Frame
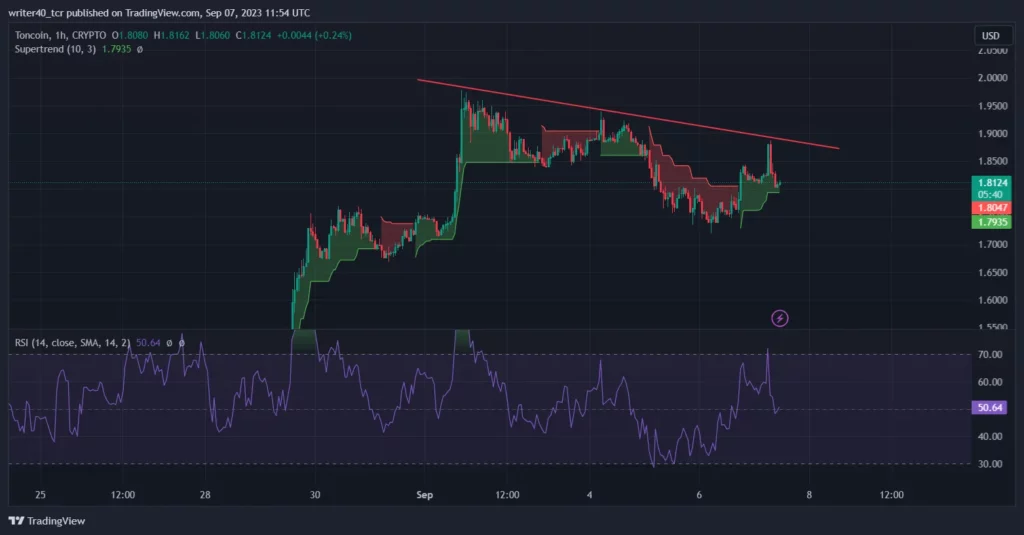
In a 1-hour time frame, Toncoin is forming lower highs and lower lows. It is a bearish structure, but their super trend indicates that the price is bullish on a 1-hour time frame.
If we connect the highs, it is forming a downward-sloping trendline. It will act as resistance to the price.
The RSI is trading above the 50 level, which is in favor of bulls. It indicates the token still has some momentum left to move upward.
Conclusion
As per the recent trend, the price can rise further after this correction. It will try to reach an all-time high.
Once the token in a one-hour time frame breaks the trendline, it can resume its rally.
Since the price action is showing a bullish sign along with the indicator, it is a strong conviction for more upside move until and unless the $1.542 levels are not broken.
Past Performance
1 WEEK- 5.12 %
1 MONTH- 50.17 %
1 YEAR- 10.56 %
Technical Levels
- Resistance- $2.00
- Support – $ 1.542
Disclaimer
The views and opinions stated by the author, or any people named in this article, are for informational purposes only and do not establish financial, investment, or other advice. Investing in or trading crypto assets comes with a risk of financial loss.