
- Stellar (BITFINEX: XLM) is currently trading at $0.1408 with an increase of +9.9% in 24 hours.
- Stellar (BITFINEX: XLM) has a market cap of $4,145,027,405.
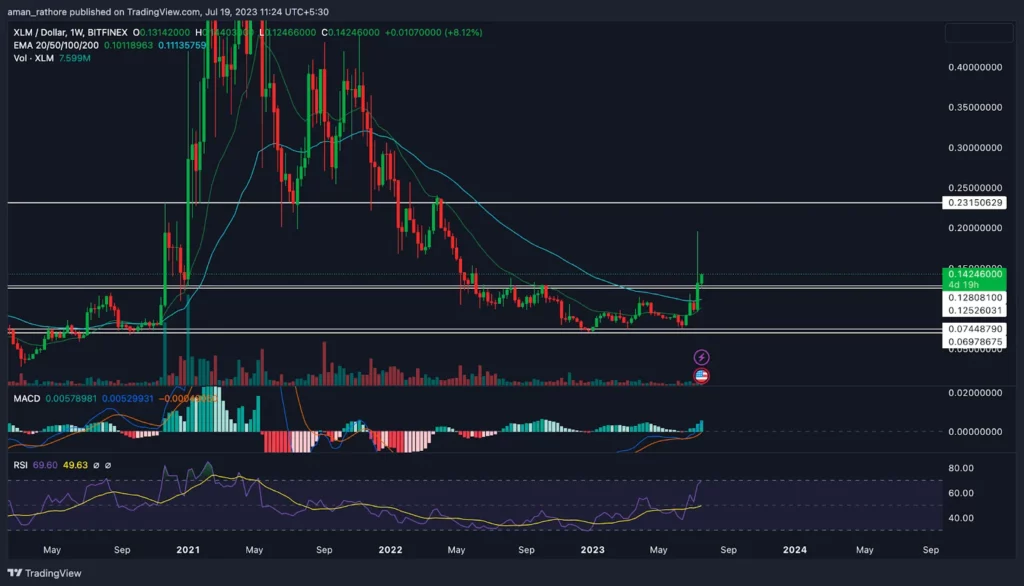
- XLM price is trading above the 50-day and 100-day EMA levels.
Stellar (BITFINEX: XLM) price is currently exhibiting an uptrend momentum based on the current market scenario.
On the charts, XLM’s price shows strength, indicating the interest of buyers. It has just provided a significant price increase in support of the volumes.
Using its cryptocurrency and decentralized platform, Stellar (XLM) seeks to offer a quick and inexpensive payment system that links businesses, individuals, and payment providers globally.
The price of XLM was moving in a range of around one year in between the range of $0.0744 to $0.128.Recently, the price of Stellar has given a breakout with a good volume.
In the last month’s period, Stellar (XLM) has shown a massive growth of around 83%, indicating the presence of a strong structure. This means that the XLM price is likely to rise in the upcoming days.
Stellar (BITFINEX: XLM) Technical Analysis
Stellar’s price experienced a significant decline due to the general bearish trend in the cryptocurrency market, but it has recently begun to recover after hitting a low of $0.070280. Currently, it is trading in an uptrend with higher high structures, a rise of +118.29% in trading volume.
Stellar (XLM) Indicator Analysis
EMA
Although the price of cryptocurrencies has been falling, resulting in a bearish crossover in the market, they have since risen above the 20, 50-day exponential moving averages, indicating that buyers are still present in the market. If the buyers can maintain the pressure, a bullish crossover and a large increase in the market can be seen.
RSI
The RSI for the XLM rises from the oversold zone and trades above 65, indicating buyer dominance in the market as seen by the formation of new higher highs. The RSI, which rose to the top in a single movement also points to further bullishness in the market trend.
Conclusion
In the Stellar (XLM) chart, the market has provided a bullish breakout, the RSI is trading above the 50 levels, the market is developing a new higher structure, and there has been a good increase in volume, which reflects traders’ interest in cryptocurrencies. As a result, the price of the XLM cryptocurrency may increase during the forthcoming event.
Technical Levels
- Support Level –The Nearest Support Zone for XLM $0.12808
- Resistance Level – The Nearest resistance Zone for BSV $0.2315
Disclaimer
The information provided in this article, including the views and opinions expressed by the author or any individuals mentioned, is intended for informational purposes only. It is important to note that the article does not provide financial or investment advice. Investing or trading in cryptocurrency assets carries inherent risks and can result in financial loss.