
- Intl Business Machine Corp (NASDAQ: IBM) price prediction shows that the IBM stock price moves in a range
- IBM stock reported a loss of 7.21% in the last 6 months.
- IBM stock is getting close to the resistance of $139
Intl Business Machine Corp’s (NASDAQ: IBM) price prediction reveals that the IBM stock price has been trading in a range-bound market for quite some time. The market started falling at the start of 2023 and the price fell 16% to the support level of $120. It was followed by a bullish recovery which started in May 2023, where the price managed growth of 10.61% to its current market price
At the time of writing, Intl Business Machine Corp. closed its trading session on Tuesday, 11th July 2023 at $134.44. The market closed with a rise of 1.16% over the previous day.
Can Intl Business Machine Corp get a Rebound from the Support?
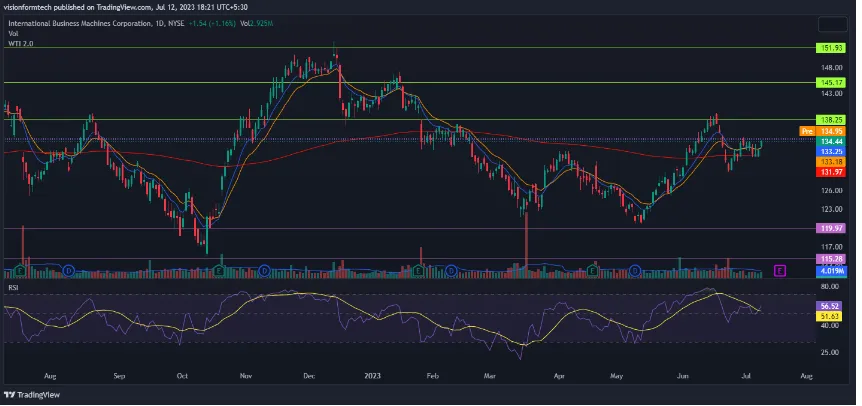
The International Business Machine Corp. stock price prediction reveals that the stock has been following an uptrend since May 2023. The bulls were able to pierce through the resistance of $131.53. The IBM stock price went up to the resistance of $138.25 before getting a correction of 6.87%.
The correction was succeeded by a series of bullish sessions, which are helping the price recover from the pullback. The short term is bullish as the IBM stock price is creating a higher high with a higher low. The range-bound market has attracted the likes of swing traders who like to make the most of a dedicated range where it becomes easier to predict the direction of the price.
The Market creates Lower Lows
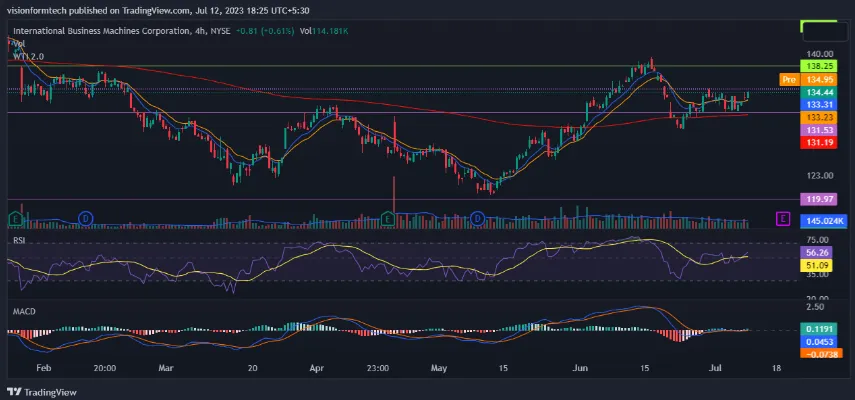
On the 4-hour chart. The price action suggests that the price has entered a consolidation phase. It can be identified by the flat 9, 5, and 200 EMAs. The Price did manage to close above the 200 EMA, which is rather bullish. The price is taking a bounce at the 50% Fibonacci retracement level, which is drawn from the swing low of $120.
It means the price may continue to move up, and the bulls could try to break the resistance of $139. The volume declined when the market started its correction in June 2023. The IBM Stock price is getting closer to the local resistance of $135. A sustained breakout may add to the confirmation of the price surging to higher levels.
RSI: The RSI indicator is currently at 56.26 on the 4-hour chart. RSI has made a bullish crossover with its MA. It is an indication that the price may move up in the short term.
MACD: MACD has made a bullish crossover. However, the MACD and the signal line are moving very close to each other at the 0 lines. This is a signal of sideways momentum and the trend is unclear.
200 EMA: On the 4-hour chart, the price is trading above the 200 EMA. This is a buy signal and it indicates the bears are in control. The 200 EMA acts as a dynamic support and the prices may continue to move up until the price breaks below the indicator.
Conclusion:
Intl Business Machine Corp’s (NASDAQ: IBM) price prediction reveals that the IBM stock price has been trading in a range-bound market for quite some time. The market has taken a bounce from a swing low and judging from the past, the IBM Stock price is heading to the resistance of $145. Investors should consider a good risk management strategy to trade this range-bound market.
Technical Levels
- The nearest support level: $131.53
- The nearest resistance level: $135
Disclaimer:
The views and opinions stated by the author, or any people named in this article, are for informational purposes only and do not establish financial, investment, or other advice. Investing in or trading crypto assets comes with a risk of financial loss.