
- AZN is a British multinational biotechnology and pharmaceutical company.
- AZN was founded on 6th April 1999. The stock is listed on London Stock Exchange(LSE).
- We will analyse the stock price and withdraw some information from the stock.
The net income of AZN in 2022 was $3.293 Billion. Its total revenue in 2022 was $44.351 Billion.
The total worth of assets in 2022 was $96.483 Billion which decreased as compared to the previous year.
Its total operating income in 2022 was $3.757 Billion. Lets analyse the stock through technical analysis.
Technical Analysis of AZN(Yearly)
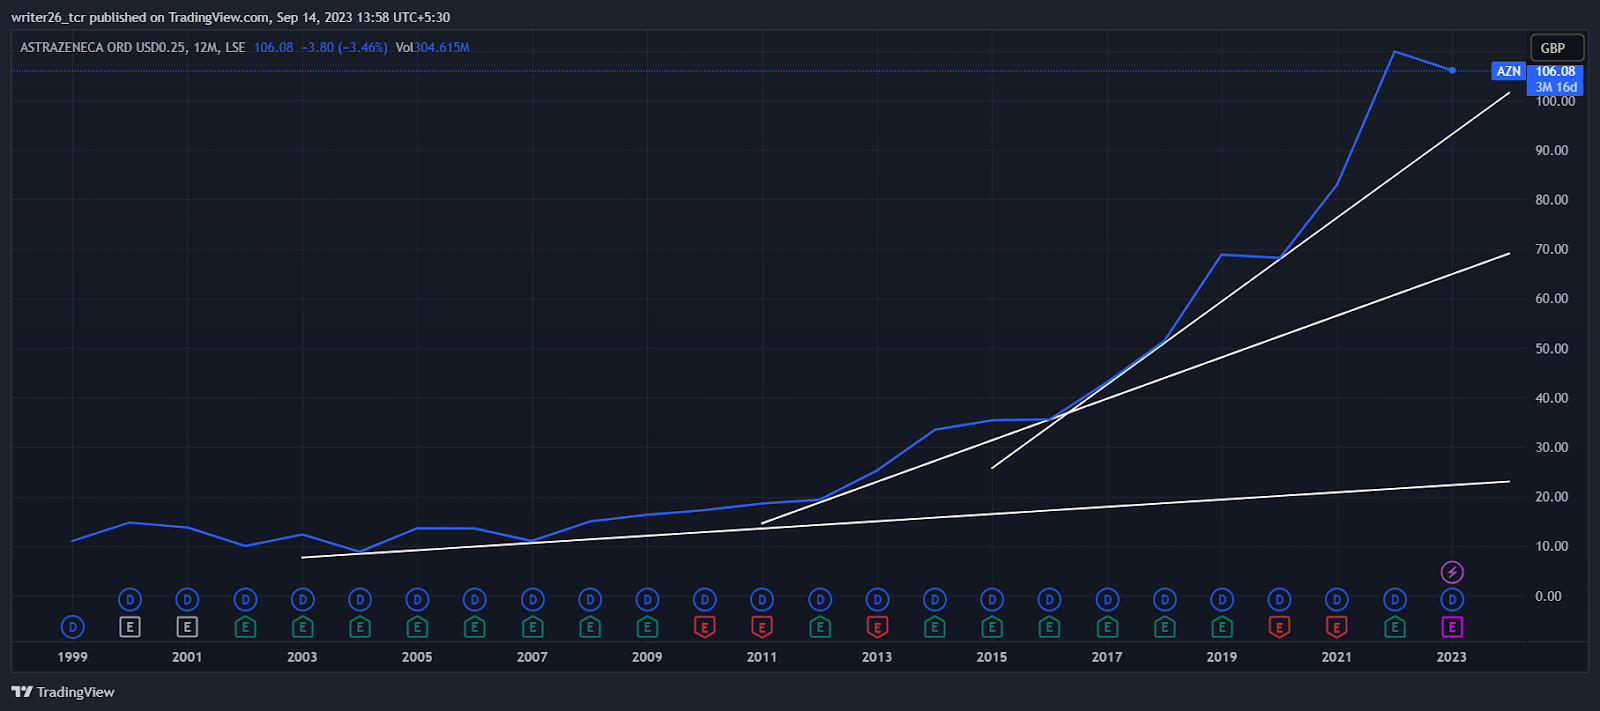
The stock is really performing well in the yearly time frame. It is at a good pace and has the potential to provide good returns in the longer period.
Overall it was up by 1655% which is brilliant for any stock. Investors should keep an eye on this stock for investment.
In 2022, it went from 238.99% to 341.31% which means the share gave more than 100% returns to its investors in a single year.
No financial or investment advice is given but there is an opportunity for investors to invest when the stock retrace till £100 price.
It might take support from the trend line and make new higher highs and higher lows.
Technical Analysis of AZN(Monthly)
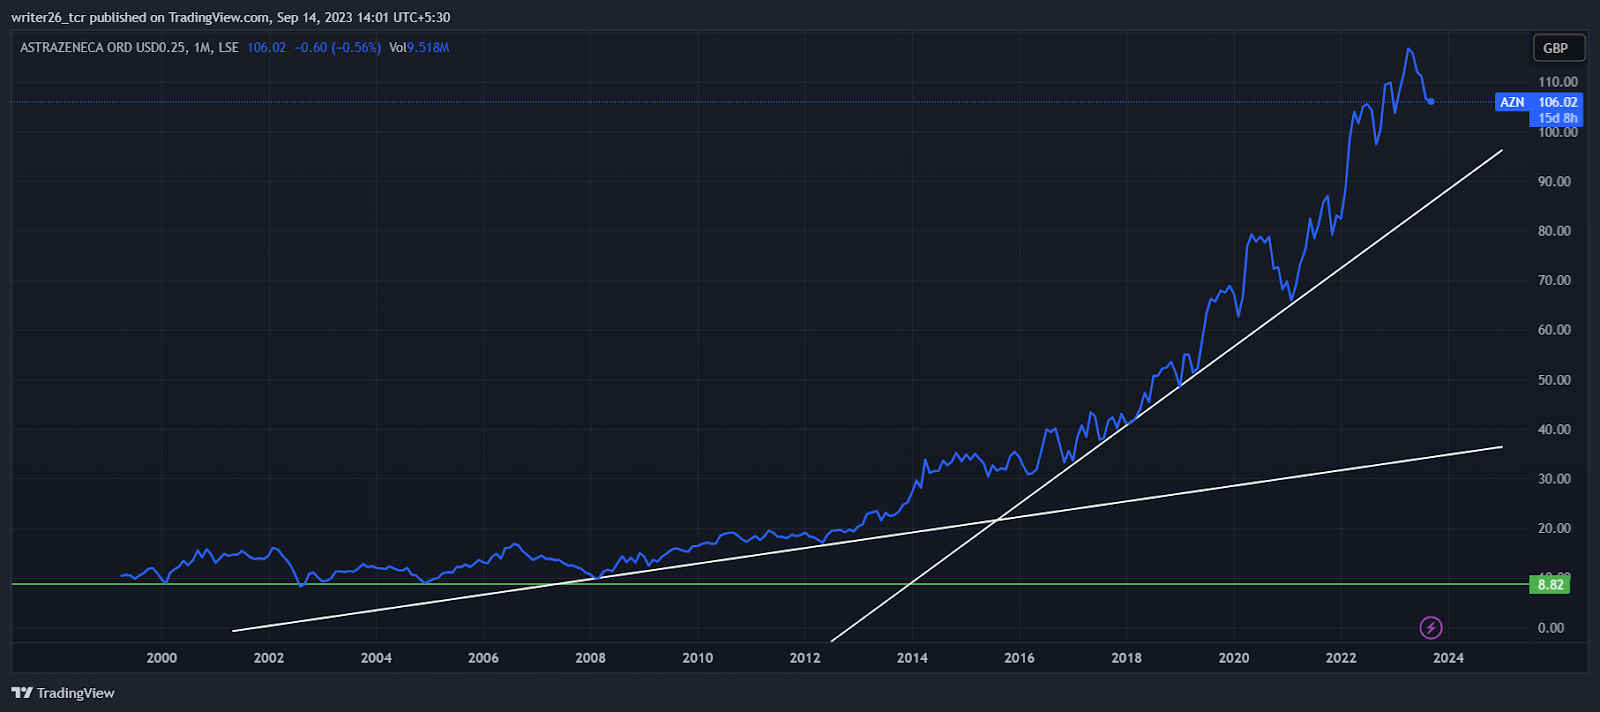
The stock is in a boost mode as it is moving up only at a great speed. The stock is highly preferable for long term investment.
In 2023, it went from 6.50% to 7.22%. The data is from 31st Jan 2023 till 31st August 2023. It was down by (4.41%) last month.
Due to increase in the sales in 2022 of covid vaccines the share price is moving higher. Its earnings also increased by 5.3% yearly on average.
Technical Analysis of AZN(Weekly)
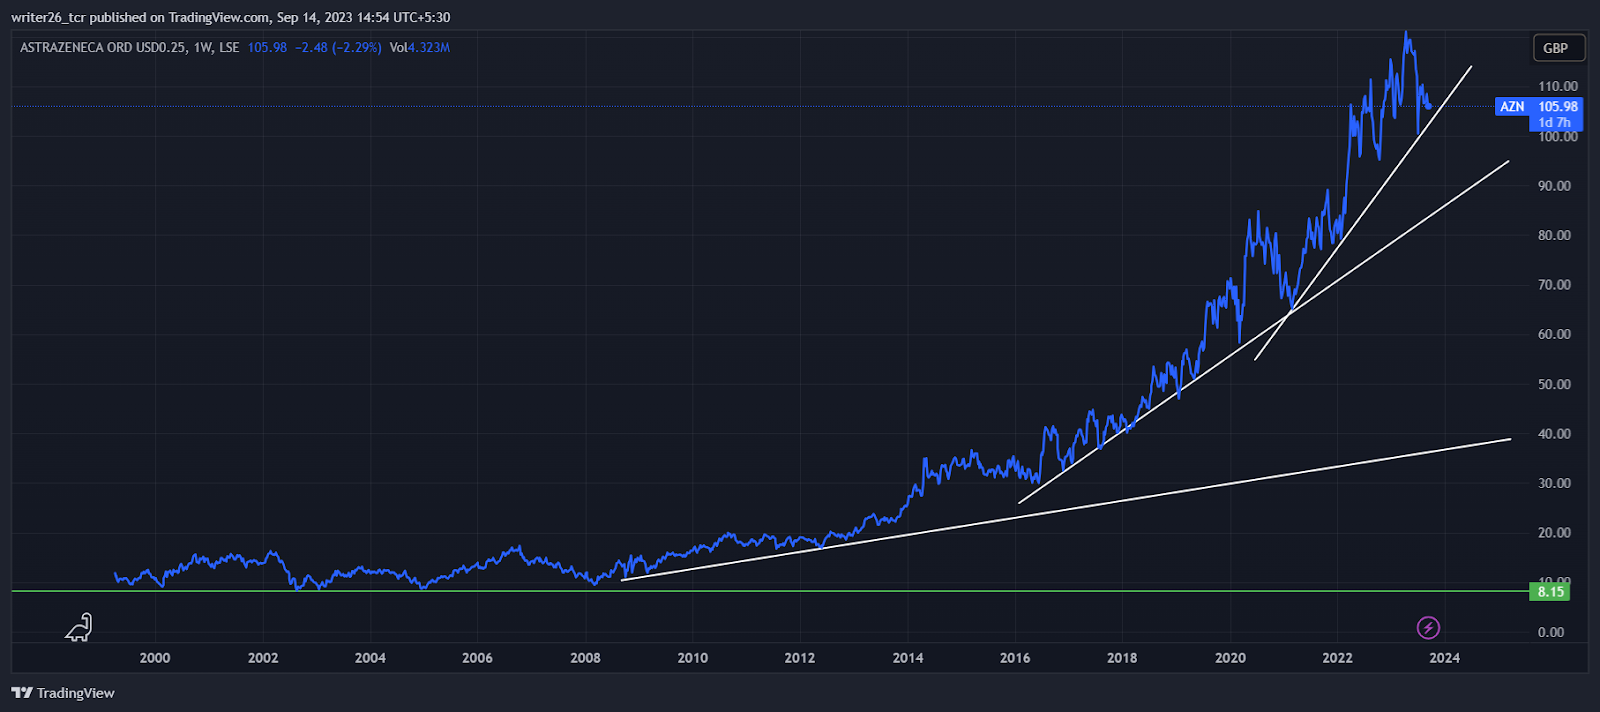
The stock may fall till £103.55 and take support from the uptrend line to show some more upward movement.
It was down by (1.99%) in the last 5 trading sessions. The stock is good for short term investment.
Technical Analysis of AZN(Monthly)
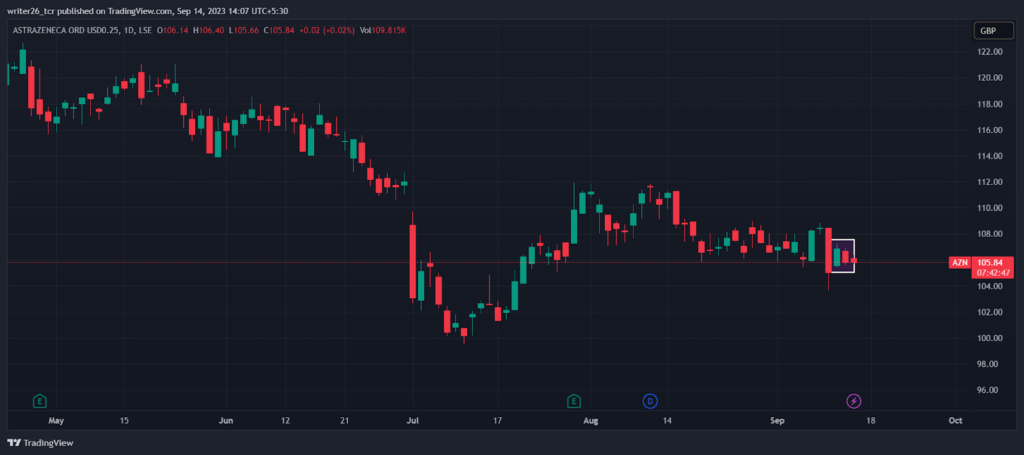
The pattern in the rectangle is known as a bearish harami. It indicates that the prices might start to move in the down direction.
Today it was up by 0.40% which is good as the stock is retracing to some point.
Summary
Through the evaluation of stock with the help of technical analysis we can withdraw that overall the stock is in an uptrend position.
In the monthly time frame, it was in an upward direction which can help to earn good returns.
In the weekly time frame, it is moving in the up direction.
In the daily time frame, it is in uptrend. Overall it is in uptrend and in all time frames also it is moving up only.
So the stock does have potential to generate a good amount of returns on the investment made by the general public in the yearly and monthly time frame.
Technical levels
Resistance Level- £111.84
Support Level- £104.67
Disclaimer
The views and opinions stated by the author, or any people named in this article, are for informational purposes only. They do not establish financial, investment, or any other advice. Investing in or trading stocks comes with the risk of financial loss.