- Centrica is a British multinational energy and services company. It supplies electricity and gas in the UK and Ireland.
- This company was founded on 17th Feb 1997. Its CNA stock is listed on the London Stock Exchange (LSE).
- In this article, we will analyze the CNA stock price.
The CNA stock is up by 3.17% in the past 5 years and it is up by 94.25% in comparison to the last year’s performance. The stock is up by 9.89% in comparison to the last month, which is a good sign of recovery. The stock overall is in a sideways position. Moreover, we will evaluate the stock value through technical analysis to predict its future movements.
Technical Analysis of CNA (Yearly)
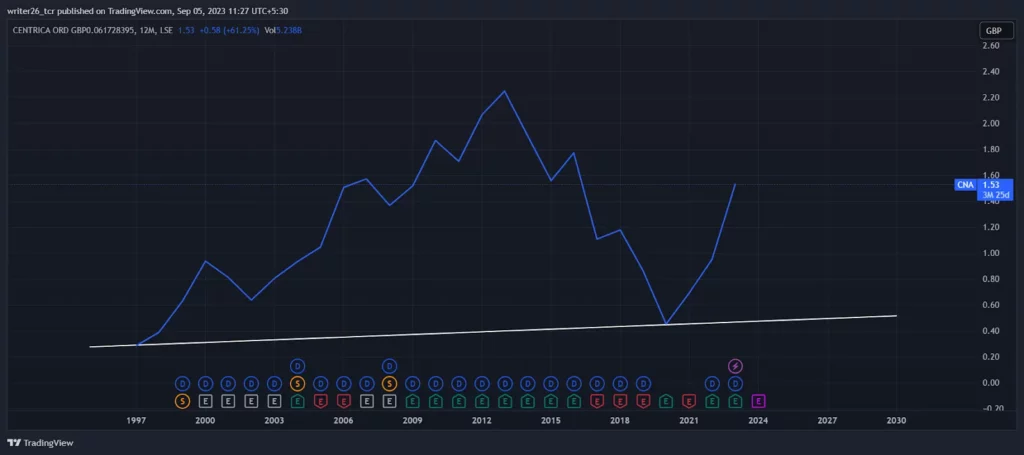
The stock was in a continuous uptrend till January 2013. It was a reliable pick for investment till 2013, but it fell drastically after that. The stock started its recovery in January 2020 and the stock is in continuous uptrend without any retracement in the yearly time frame. The stock is good for big-period investment or long-term investment. Investors can invest their money in this stock because of its upward movement.
The above-depicted candlestick chart confirms that the stock will continue its uptrend in the future. The pattern in the rectangle represents three white soldiers. The pattern appears in a downtrend or a bear trend. It is a sign of reversal in the stock. The stock started moving up and it may carry on its move. If the stock is in the recovery phase, it may give multiple breakouts in the future. The chances of generating a good return on the investment are possible.
Technical Analysis of CNA (Monthly)
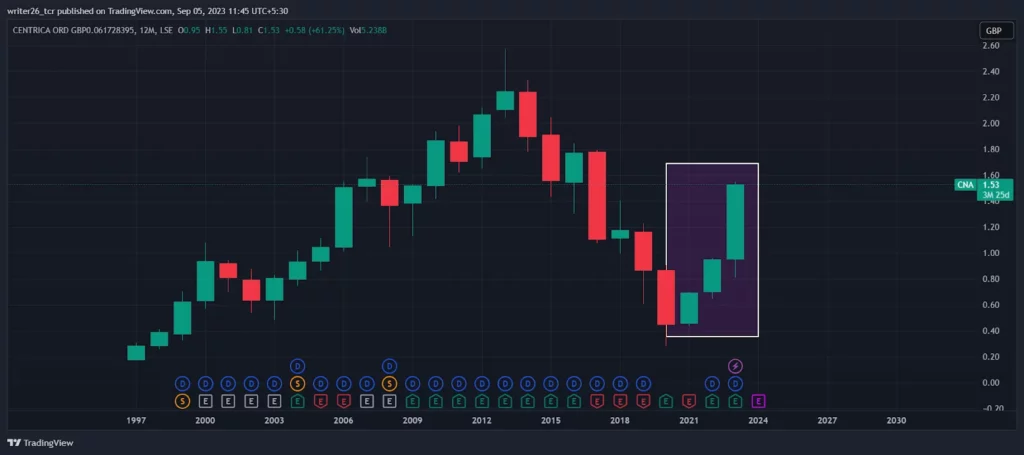
The stock in the monthly time frame is ranging between the support level and the resistance level.CNA was not able to break the all-time high that it touched in 2013. It never never crossed that level after 2013. The stock near the current market price is in an uptrend. It never retracted after 2022 as it formed a continuous straight line.
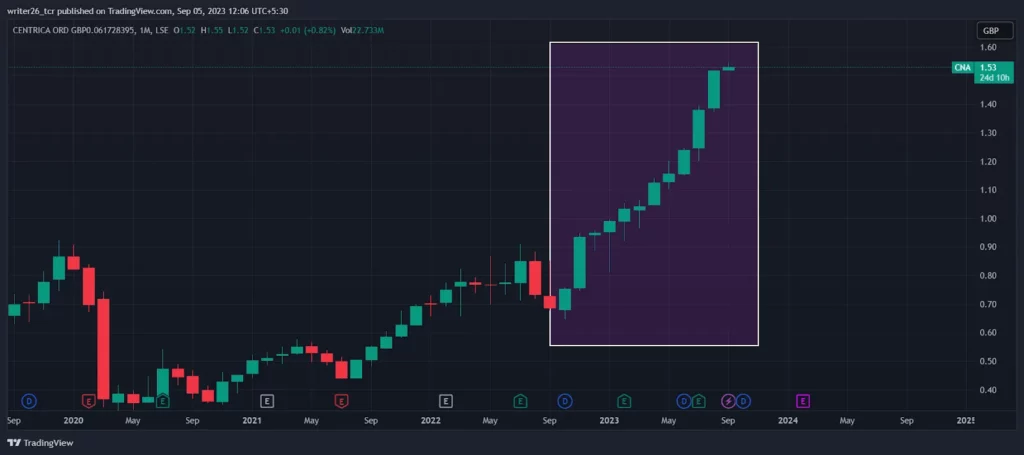
The pattern is giving us a positive signal that the stock has been forming a continuous three-white soldiers pattern. The pattern back to back confirms that the stock is continuing its upward movement. It will continue the upward march in the future. The pattern appeared four times in a row and it is quite impressive. You can consider the CNA stock reliable for monthly investment purposes.
Technical Analysis of CNA (Weekly)
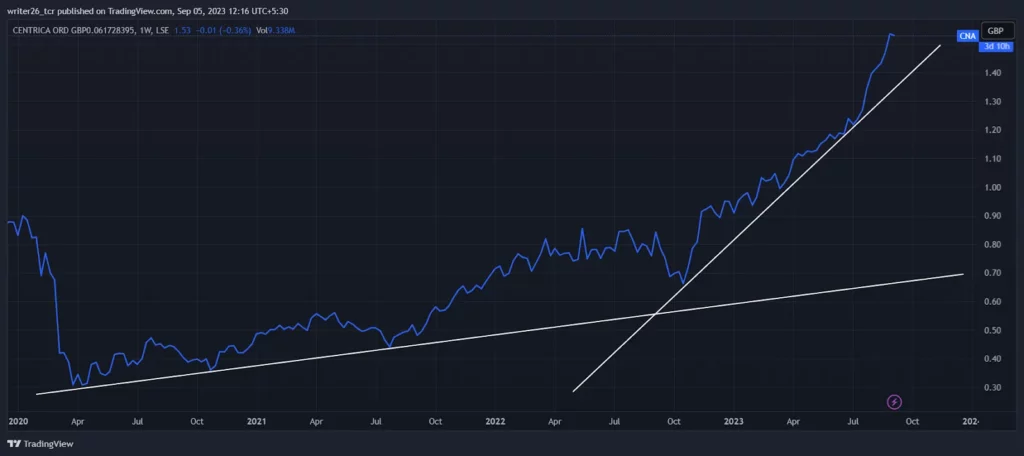
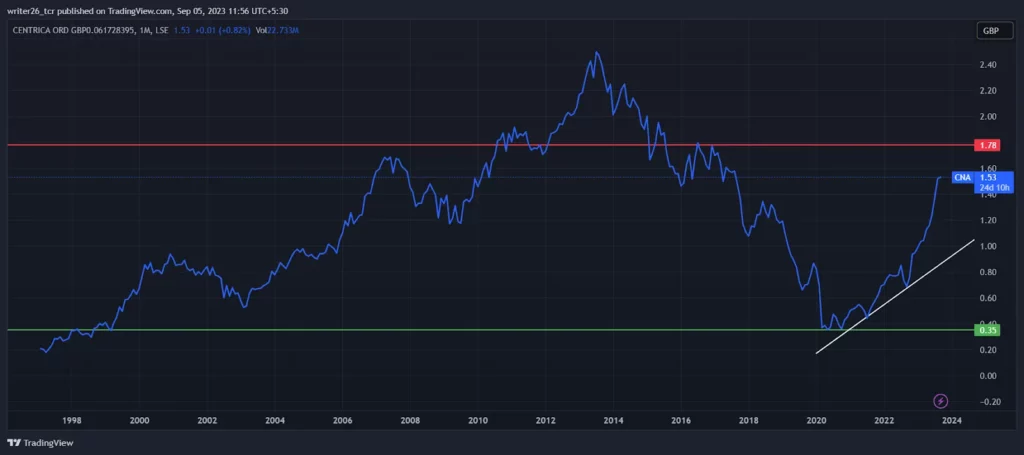
In the weekly chart, we can clearly see that the stock is on the upswing. It is currently suitable for swing trading. Investors should wait till the stock retraces to the trend line to take support from the trend line. The stock is up by 3.38% in the past 5 trading sessions. Since 2020 the stock has been performing pretty well.
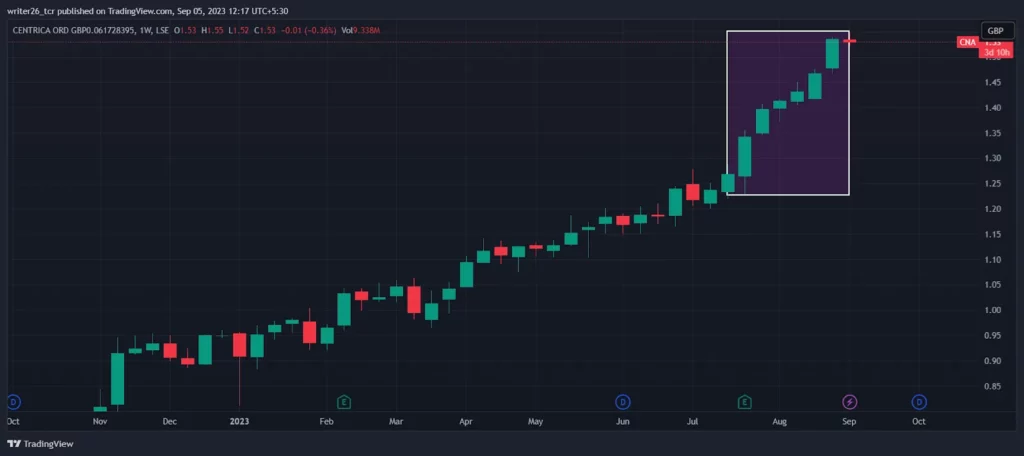
The pattern confirms that the stock will continue its upward move. The stock has also formed the same pattern in the monthly time frame. The candlestick chart clears many doubts as many patterns are formed on the candlestick pattern only.
Technical Analysis of CNA (Daily)
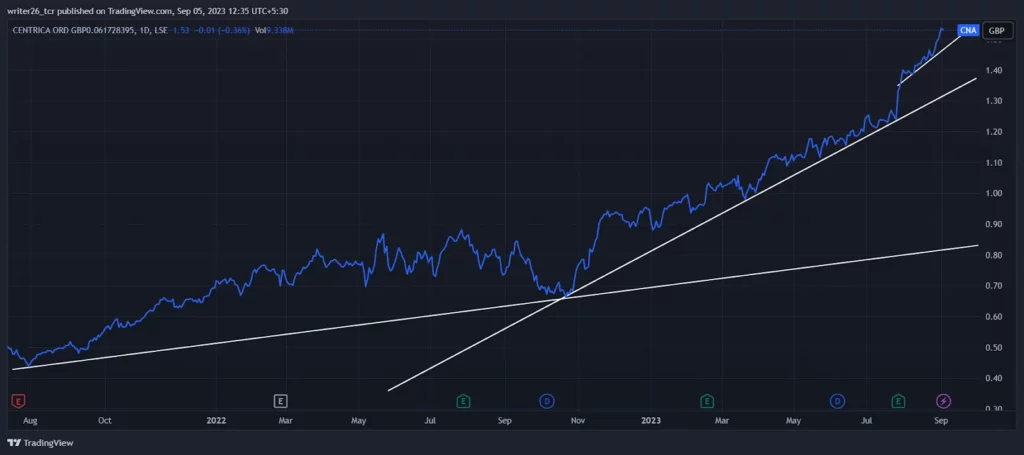
The stock near the current market price allows investing and generating good returns. We can see that the stock is doing good and is in a rally. The stock is good for all-term investments.
Summary
The technical analysis reveals the stock is in a sideways position. It can provide appealing short-term returns in the monthly time frame. It does have the potential to generate a good amount of returns on the investment made by the general public in the weekly and daily time frame. If the stock can break its range in the monthly time frame, it is also good for a medium-term investment.
Technical Levels
- Resistance Level- GBP- 0.73 and GBP- 0.82.
- Support Level- GBP- 0.89 and GBP- 0.67.
Disclaimer
The analysis is done for providing information through technical analysis and no investment suggestions are given in the article to be made by investors.