
- Bitcoin cash price augury: The prices skyrocketed after the listing on EDX.
- The coin broke all the resistances in the past 1 year. What’s left?
- A gap is seen in MACD and EMAs. Will it go forward or is it just a deviation from the period?
Citadel-Backed EDX Listed ‘Bitcoin Cash’ along with ‘Bitcoin’ and ‘Ethereum ’
Bitcoin Cash is a proof-of-work blockchain network that acts as an altcoin to the famous Bitcoin. This means it is designed for faster and cheaper altcoin use. Its token’s name is BCH.
Ciated-backed EDX listed BCH on June 20, with some big names in the market, including Ethereum, Bitcoin, and Litecoin. This has not only increased the coin’s reputation but also resulted in the price of it rising over all the resistances in the past 1 year.
EDX is a platform for institutional investors. Only when it gave this opportunity to BCH, it rose more than 37% in just 3 days
BCH‘s Previous Action and Forecasting
Bitcoin Cash Previous Price Action
The price of the coin, if we take a look at the end of December 2022, the price took a support of $95 and the bears faced rejection. After that, the price started going in an upward momentum.
It reached a high of $154 at the end of February. Some correction was seen with the price consolidating between a cap of about $139 and a floor of $101. The cap was broken in mind in June 2023 as the coin’s price rose up from $135 to a sky-high of $329.0,
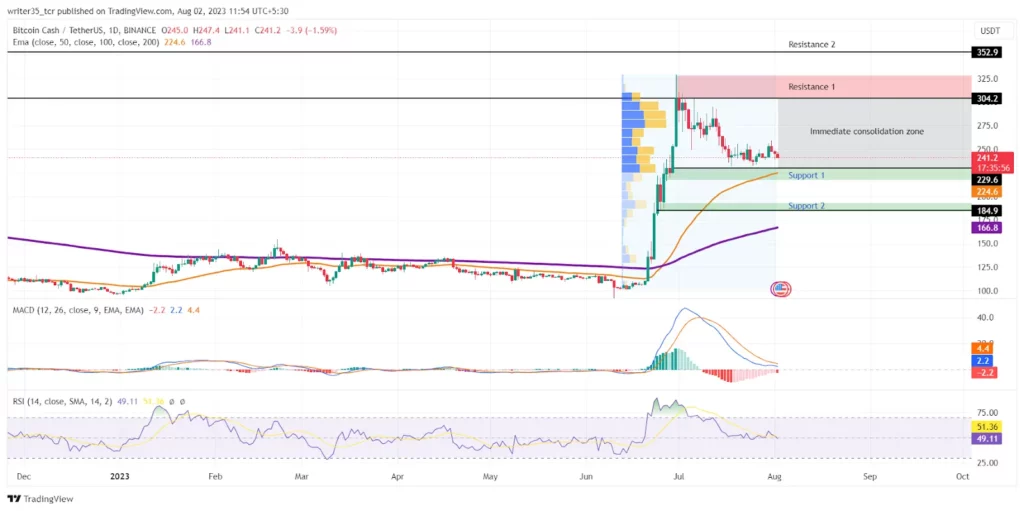
Currently, the price is rolling in between consolidations after the positive news of the Citadel-Backed EDX listing, which has given confidence to the bulls, which is getting reflected in the price.
Supports and Resistances: The first & immediate support is shown at a level of $229.6, which is backed by a good volume that can ‘support’ the bulls. The second support is seen at the level of $189, which also has some volume backing writing for the resistances.
The first resistance is at the level of $304. The confirmation takes us long back to April 2022 when the support level was broken creating the current resistance. The second resistance also takes up back to the month of April 2022 when the price was getting resisted at the level of $352
Indicators
MACD
The signal line in the MACD of 12,26,9 is indicating a bearish momentum after a high rise. Although the MACD line and the signal line are still above 0, as of this writing, the signal line is at 4.5 and the MACD line is at 2.2.
RSI
The RSI is quiet currently and it stands on the stage with nothing to say. The level stands at 51, which is giving the signal for the sideways after touching a level of 89.
Moving Averages
The 50 EMA crossed the 200 EMA back in June 2023, which already indicated an uptrend, as the distance between the two is getting increased the trend is likely to continue the same. The levels currently are $224.6 for 50 EMA and $166.8 for 200 EMA.
The prediction will stand with the first supports and resistances. If the price breaks the level of $229, it is likely to be supported by the 2nd level of $184. Currently, the gaps between EMAs and the MACD and signal lines are seen to be increasing.
If the above gap scenario continues, it will be enough fuel for BCH to pull over the resistance levels.
Conclusion
Bitcoin cash which is designed for faster and cheaper altcoin use is a proof of work blockchain network, which acts as an altcoin to the famous Bitcoin. It was recently added to the EDX, and since then, the coin has gained popularity with a price hike. The previous 1-year resistance is broken with some more momentum for the bull run if it bounces off the support.
Technical levels
Support: $229, $184
Resistance: $304.2, $352.9
RSI: 51
50 EMA: 224.6
200 EMA: 166.8