- Currently, Google’s price is trading at $133.
- There has been a big breakout of the resistance level of $127.
Google, which is part of Alphabet Inc., is a top-performing company in its sector, outperforming 95.59% of other companies. One of its remarkable strengths is its exceptional profit margin of 21.05%, indicating a high level of profitability.
Over the last several years, Google has shown improvements in its profit margin, reflecting the company’s ability to generate higher profits from its operations.
Recent news about Google’s announcement to launch an artificial intelligence (AI) product could have a significant impact on the AI market and potentially contribute to a surge in Google’s stock price. Investors are likely to be optimistic about the potential growth opportunities associated with Google’s AI venture.
Regarding its financial performance, Alphabet Inc.’s revenue increased by 7.06% in the second quarter of 2023 compared to the same quarter of the previous year. This growth in revenue highlights the company’s ability to generate higher sales and indicates a positive trend in its business.
In the Internet Services & Social Media sector, which Google is a part of, there was an 8.1% increase in revenue. This suggests that the sector as a whole is experiencing growth, and Google’s performance in this context further solidifies its position as a leading player in the industry.
Will Google Price Rise in the Coming Days?
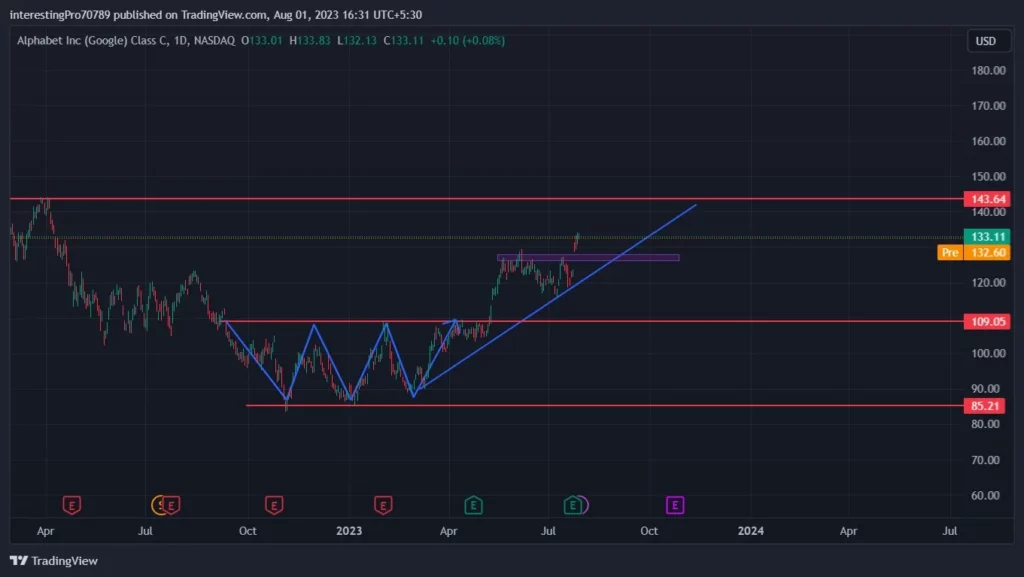
Around October 2022, Google’s price began forming a bullish reversal pattern known as a triple bottom. The breakout of this pattern in May 2023 signified a shift in momentum from bearish to bullish, indicating potential opportunities for long positions.
Subsequently, the price encountered resistance at the $125 level, forming what seems to be a descending triangle pattern. However, in July 2023, the price successfully broke out above this resistance, reinforcing the bullish sentiment and signaling the continuation of the uptrend.
Currently, the price is trading above the $125 level, which is now acting as potential support. Traders should be watchful for a short-term retest of this level before any further upward movement. A successful retest of $125 could serve as a strong base for long positions, with a potential target of $143.
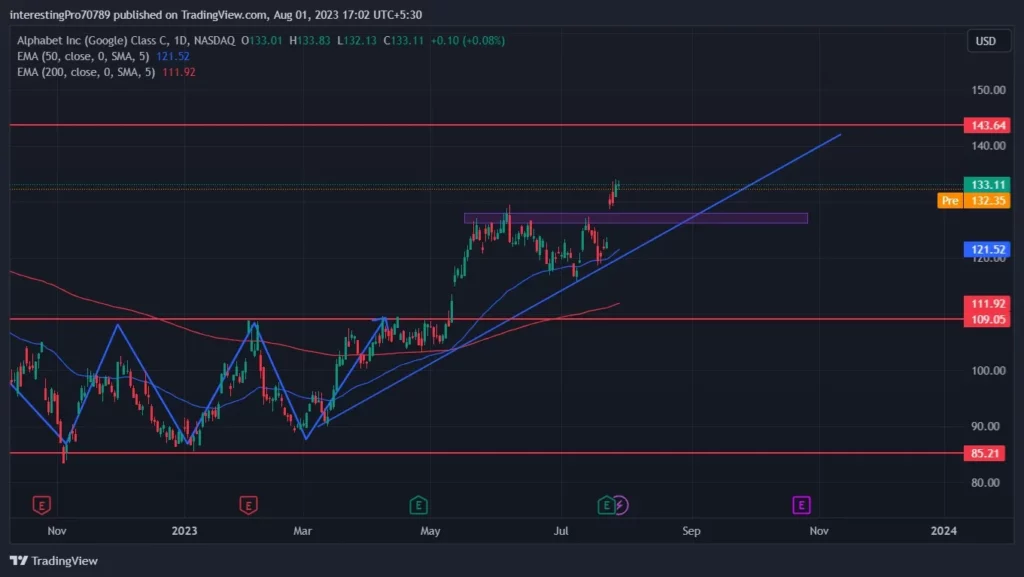
In May 2023, a notable event occurred in the price chart of the stock, with the 50 EMA (blue line) crossing above the 200 EMA (red line), forming a “Golden Cross.” This technical event is a strong bullish signal, indicating a potential shift in momentum from a bearish to a bullish trend.
The significance of this crossover lies in its ability to signal the continuation of an uptrend. As long as the price remains above both EMAs, it signifies that the bullish momentum is still intact, and buyers are dominating the market.
The upward trending direction of both EMAs after the crossover reaffirms the positive sentiment, suggesting that the stock’s recent price movements have been robust, with consistent buying pressure.
Investors and traders often interpret the Golden Cross as a favorable opportunity to consider long positions, anticipating further price appreciation.
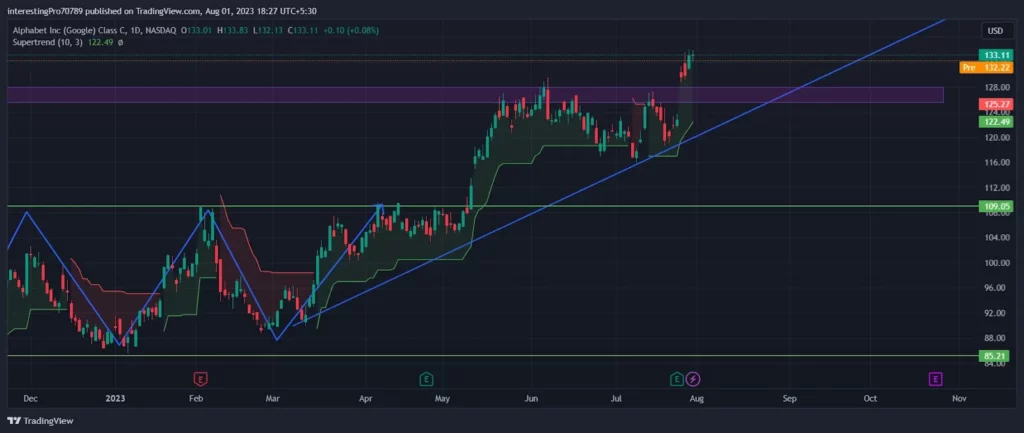
Currently, the green Supertrend line being significantly distant from the price indicates a robust bullish sentiment prevailing in the market.
As long as the price continues to stay above the green Supertrend line, it signifies a strong bullish trend, with buyers driving the market’s momentum. Traders and investors may interpret this as a favorable indication to maintain or consider opening long positions, anticipating further upward movement in the stock’s price.
Conclusion
Google is undeniably one of the strongest companies in the technology sector, supported by both its fundamental and technical aspects.
Google’s financial reports reflect positive performance and a strong balance sheet. The company’s consistent revenue growth and profitability underscore its resilience and competitiveness in the market. Moreover, the recent announcement of its Google AI initiative signals a focus on cutting-edge technology and innovation, which could have a transformative impact on the AI market. This forward-looking approach enhances Google’s potential for future growth and continued success.
Technically, the stock’s chart analysis reveals a bullish outlook for Google’s future. The Golden Cross, with the 50-day EMA crossing above the 200-day EMA, is a significant bullish signal, indicating a potential shift in momentum to the upside. The stock’s strong price performance supports this view, suggesting that buyers are driving the market’s sentiment.
Technical levels
Resistance levels: $143
Support levels: $125
Disclaimer
The views and opinions stated by the author, or any people named in this article, are for informational purposes only. They do not establish financial, investment, or other advice. Investing in or trading crypto assets comes with a risk of financial loss.