
- The price of IOTA (MIOTA) is trading at $0.191.
- IOTA’s (MIOTA) market cap is $503.785 Million.
- IOTA (MIOTA) price has been observed to increase by 7% in the last two market sessions.
In order to facilitate safe transactions and communication inside the IoT ecosystem, MIOTA is a distributed ledger technology (DLT) protocol and blockchain-based cryptocurrency for the Internet of Things (IoT). A distributed agreement system (DAG) that is decentralized and scalable, MIOTA is built on the Tangle (Royalty-Free) technology. MIOTA is a perfect M2M protocol because its major goal is to make data exchange and microtransactions between IoT devices easier.
By analyzing the chart in a daily period, the MIOTA is now experiencing an uptrend and setting higher lows. IOTA’s price has been declining since 2021 and has decreased by about 92% since then. It’s also significant to note that the price has shifted away from $0.14919094, a crucial support level.
On the chart, a triangular pattern has formed, and if the price breaks out of the triangle, there will likely be some very strong momentum. The price is currently very close to a significant resistance level, so if it does break through that level, you should anticipate some substantial movement.
Technical Analysis (1D Timeframe)
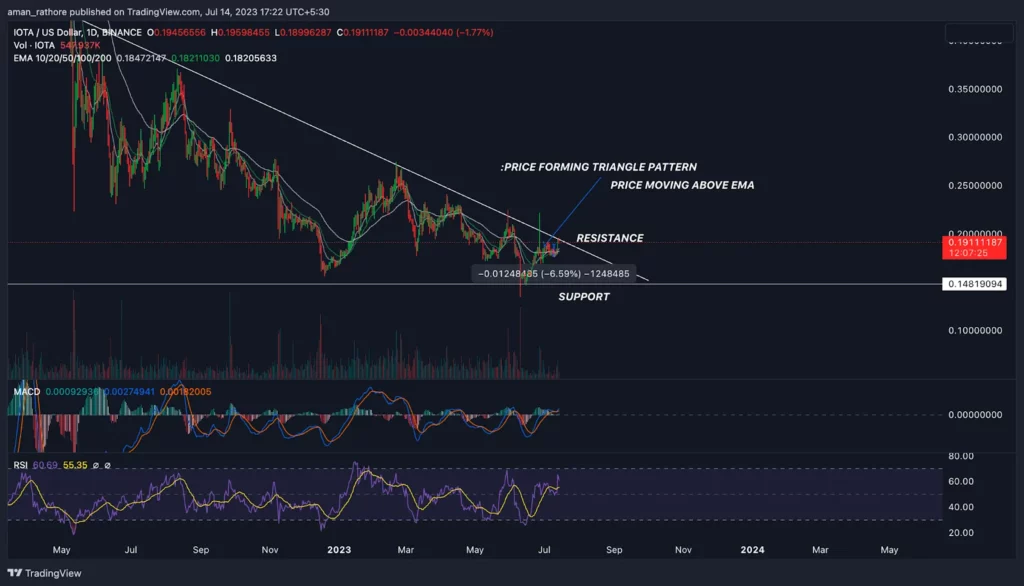
IOTA Price Analysis
EMA:
The exponential moving average (EMA) and the price of the IOTA cryptocurrency are currently above each other, and as long as the EMA advances in the right direction, it is indicating a positive move
RSI:
The signal line for MIOTA’s relative strength index (RSI) is about 55, and the RSI line is above the SMA line, indicating that the price is extremely likely to rise above the level and take control of it.
MACD:
The MACD line in the daily timeframe in the market scenario is passing over the signal line which favors the bullish move, indicating a change in trend in favor of the bulls. This could soon be interpreted by traders as a bullish sign for the price of MIOTA.
Trendline Analysis:
According to trendline analysis, the MIOTA price is moving away from support and parallel to the trendline, indicating that it will likely continue to rise. This indicates that the price will climb further and approach the top of the channel.
Conclusion
As per the analysis of IOTA in a daily timeframe, several indications are emerging that lead to an increase in MIOTA price. A rise in price can be expected if the level described above can be broken with sufficient volume. The overall trend of the IOTA coin is bullish when looking at the long-term chart. The bullish indicators include MACD, RSI, and EMA.
Technical Levels
- Support – The current support level of the IOTA coin is $0.1481.
- Resistance -The current resistance level of the IOTA coin is 0.1972.
Disclaimer
The information provided in this article is solely for information purposes and is not intended to provide financial, investment, or any other advice. Trading or investing in crypto involves the risk of loss.